Understanding SCORM Cloud Debug Logs
Debug logs provide detailed information about what happens behind the scenes when your course runs in SCORM Cloud. While you may not always need them, they are essential for troubleshooting issues. Here's how to access and use them:
Accessing Debug Logs
There are three ways to access debug logs:
1. Through Your Course:
- Navigate to your course in the Library.
- Enable the Navigation Bar in your course settings and save.
- Launch your course and interact with it.
- Click "View Debug" in the Navigation Bar.

2. From the Course Sandbox:
- Select your course in the Library.
- Choose the specific session you want to review.
-
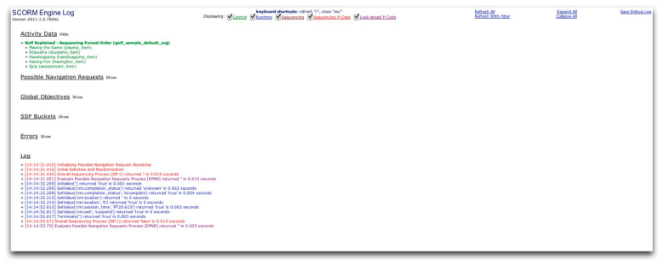
The debug logs for that session will open. You can share these logs by copying the provided URL at the bottom of the screen.
3. Using Browser Developer Tools:
- Open your browser's developer tools and click the "Console" tab.
- Ensure the console is referencing the player page's frame (not the content frame).
- Type Debug.ShowAllAvailableData() and press Enter. This will display the debug data.
Why Use Debug Logs?
Think of debug logs like checking under the hood of a car. When everything is running smoothly, you don't need to look. But when something goes wrong, they help you pinpoint the problem by revealing the underlying processes.